Pixeled Eggs’ recently launched BIMA Charities in Need report reveals many mid-sized charities fail to deliver satisfactory user and mobile experiences to their supporters and beneficiaries.
The report focused on charities with an income of £100k-£10m in England and Wales that includes 33,000 charities with a combined income of £28bn [i]. It examined the Platform, Technical and Usability performance of 411 charity websites [ii] to compile a database of over 20,000 data points.
Two big themes came out of the report:
1 – Usability. Many charities are failing to apply a user centric approach
2 – Mobile. Many charities missing the mobile opportunity
1. Usability
UX researchers NN/g claim that “the first requirement for an exemplary user experience is to meet the exact needs of the customer, without fuss or bother”[iii] which is a great working definition.
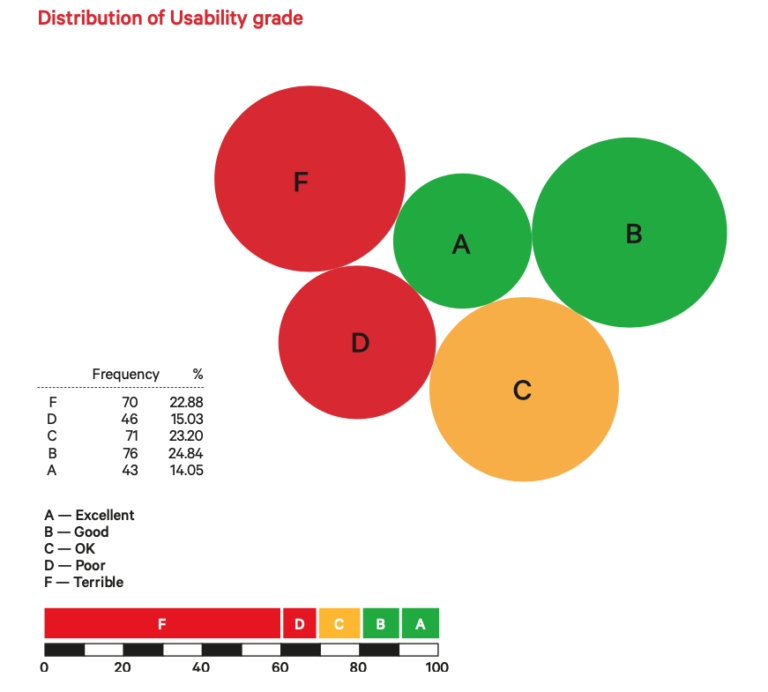
The audit results indicate some charities don’t understand this and are failing to maximise their impact. 39% of audited websites received a D or F usability grade, while 39% received an A or B.
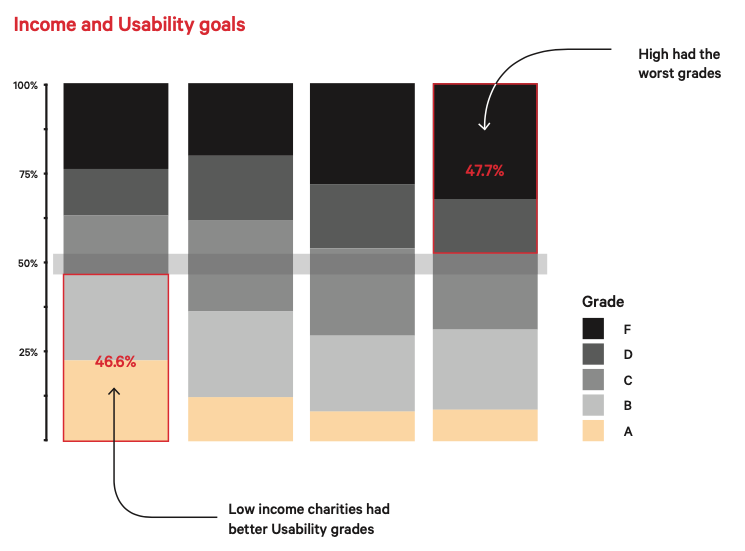
The audit also reveals that higher income charities (£2.7-10m income) struggle to deliver good or excellent user experiences compared to their lower income (£100-310k) counterparts. Lower income charities achieve 47% of As and Bs, while higher income charities received 48% of Ds and Fs.
While there is little data on the impact of poor usability in the charity sector, there is plenty in retail where sales are vital. Business Insider estimate that US $4.6 trillion are left on the table by merchants due to abandoned shopping baskets in 2016, up from $4.2 trillion in 2013[iv].
Of course not all of this is caused by poor usability, but it is easy to see that those that offer the best user experience maximise revenue.
Alongside this there is growing evidence that a website user experience is a core part of the brand experience [iv], which means that a poor website experience creates a poor perception of the brand. This means that as well as reducing engagement and revenue, many charity websites are damaging their brand perception.
2. Mobile
Mobile was another weak point for charity websites. 1 in 10 audited charities had no mobile website, while mobile versions of websites received 75% of all F grades.
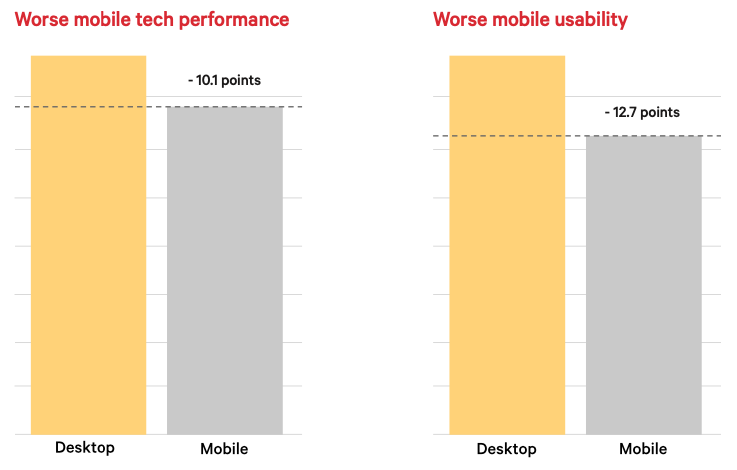
So what is the impact of poor mobile performance? Global mobile traffic is ahead of desktop by about 4%[v] so the lost opportunity for beneficiary and supported engagement must be recognised.
There is little data to be found on charities or from the UK, but we can see how important mobile is in US retail behaviour. In the US, 6 in 10 internet users start shopping on one device but finish on a different one [vi], and 82% of smartphone users say they consult their phones before purchase [vii]. They get ideas, look up information, and make decisions, all from their smartphone anytime, anywhere.
It is easy to see how supporter engagement and beneficiary support would also run across different devices at different points in the dynamic between charity and individual.
So what can be done to tackle this? Key recommendations in the BIMA report include:
Pixeled Eggs partnered with BIMA to produce this audit to enable charities to take an informed look at their website strategy and performance. I hope it will encourage charities to re-consider and re-prioritise how digital fits within charity’s overall strategy, and becomes a useful tool that helps charities get the most from their websites and digital.
If you would like to compare your charity website to the report directly Pixeled Eggs can create a scorecard for your website. You can find out more here.
You can also download a free copy of the report here.
—
[i] Charitybase.uk
[ii] Charity websites audited were randomly selected, with an income of between £100k-£10m and registered in England or Wales. Education, Religious and Investment Trusts where excluded.
[iii] https://www.nngroup.com/articles/brand-experience-ux/
[iv] https://www.businessinsider.com/shopping-cart-abandonment-merchants-now-leave-46-trillion-on-the-table-and-mobile-is-making-the-problem-worse-2016-11?r=US&IR=T
[v] https://gs.statcounter.com/platform-market-share/desktop-mobile-tablet
[vi] Google/Ipsos Connect, GPS omnibus, U.S. online respondents 18+, n=2,013, Mar. 2016.
[vii] Google/Ipsos, Consumers in the Micro-Moment, U.S., n=5,398 based on internet users, Mar. 2015.